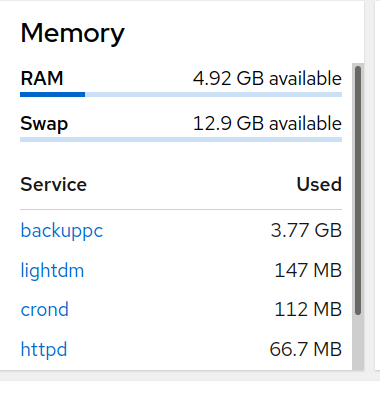
Per the caption and “Top” output below Cockpit seems to be displaying the virtual memory usage rather than resident memory for the backuppc user. What utility does this choice have in evaluating actual memory usage?
Since nobody else responded, and I was curious about the large difference, I asked Google Gemini to explain, and it told me the following (copy-and-paste, quoting):
It’s common for the virtual memory (VIRT) reported for BackupPC processes to be in the gigabytes, but this high number is often misleading regarding the actual physical memory (RAM) being used.
The high Virtual Memory Size (VIRT) is typically due to how Linux reports memory usage and how BackupPC operates, especially when using the rsync transfer method.
Why Virtual Memory is High
The very large VIRT number is usually a reflection of the total address space the process has reserved, which includes:
Memory-Mapped Files and Libraries: Linux often uses memory-mapping to handle files and shared libraries. The entire size of these mapped files and shared libraries (like the Perl interpreter and its modules) contributes to the VIRT size, even if only a small portion is currently loaded into physical RAM or actively being used. The size of the backup pool indexes can be a significant factor here.
Kernel Over-Commitment: By default, Linux can “over-commit” memory, meaning it grants a process’s request for a large block of virtual memory without immediately allocating the corresponding physical RAM. This requested but unaccessed memory contributes to VIRT.
Rsync File List: When using rsync (the default and most recommended method), the BackupPC process needs to build an in-memory table of all the filenames for comparison. If you have millions of files across many clients, this list can be very large, directly increasing the actual memory footprint (Resident Set Size, or RSS). However, even for large file counts, the RSS/RAM usage is usually much lower than the VIRT.
Using ps_mem you’ll also get different results for ram usage, which also doesn’t seem to look a RES either.
Obviously the cockpit devs chose VIRT for a reason, the same like the author of ps_mem also chose to display in the way they did. Maybe they feel that’s the best value to display. Others may argue otherwise.
Note that when BackupPC is actually doing something, then the RES value could also be far higher, than when for say it’s idle and not doing anything.
“man top” provided a reasonable explanation of what I was seeing, which I learned prior to posting this topic, and the responses here do not contradict that understanding. I just find it a useless measure, the cockpit displayed value, for my usage.
I don’t find it useless: from a potential performance analysis standpoint – if the numbers tell you that in a system with 4.92 GB of RAM, that one program is requiring 3.77 GB (77%) so if the system must utilize swap (now or in the future) it will run slower.
it is interesting: that 77% also strikes me as an example of the “Pareto Principle” (aka the 80/20 rule).